Randy Clark, POLARIS Laboratories®, April 21, 2021 | With more than 38 years’ experience with oil analysis, I’ll be the first to preach the value that oil, coolant, fuel and grease analysis offers to a reliability program.
In my early career, I devoted a great deal of time looking over each used oil analysis report, looking for those high severity reports that alerted me that a maintenance action was needed to prevent a potential failure. It was time consuming, and I always had that feeling I may be missing something important. Many of you know the feeling, perhaps from the benefit of hindsight after you experience a catastrophic failure and then go back and look at the last oil analysis report and discover, “Dang, it was right there on the report, the lab alerted me that abnormal wear was occurring.”
There were other downsides to reviewing reports on an individual basis. Acting on the high severity reports most often lead to reactive, unplanned and unscheduled maintenance. This, in effect, interfered with the scheduled and planned maintenance. It wasn’t as if extra mechanics were waiting on a bench saying, “Put me in coach, I’m ready to turn wrenches.” In reality, mechanics were pulled off their scheduled work to address the issues identified in high severity fluid analysis reports.
And what about the ‘non-high severity’ reports? Was I missing valuable data by not reviewing them, as well? After all, wouldn’t low severity trending be an indication of something we were doing right, and wasn’t there something we could learn from it?
There had to be a better way, a method that would keep me from losing focus on the individual high severity reports, while at the same time enabling me to see the bigger picture and understand the common causes of high severity reports amongst common component types. Gaining insight to what was causing high severity reports and doing something to prevent the high severities from happening were essential.
My Solution… Pareto Charts and Scattergrams!
As most are aware, the Pareto Principle, also known as the 80/20 rule, says that 80% of the effects come from 20% of the causes. Why not use this principle towards your fluid analysis program to quickly identify which component types have the highest percentage of high severity reports, and then drill down deeper to find the common causes of the high severity by component type?
To start this process, I simply ran a sample data extraction report for the time range desired, available from my fluid analysis provider. With this raw data, and a small amount of research on creating Pareto Charts in Microsoft Excel, my vision soon became a reality.
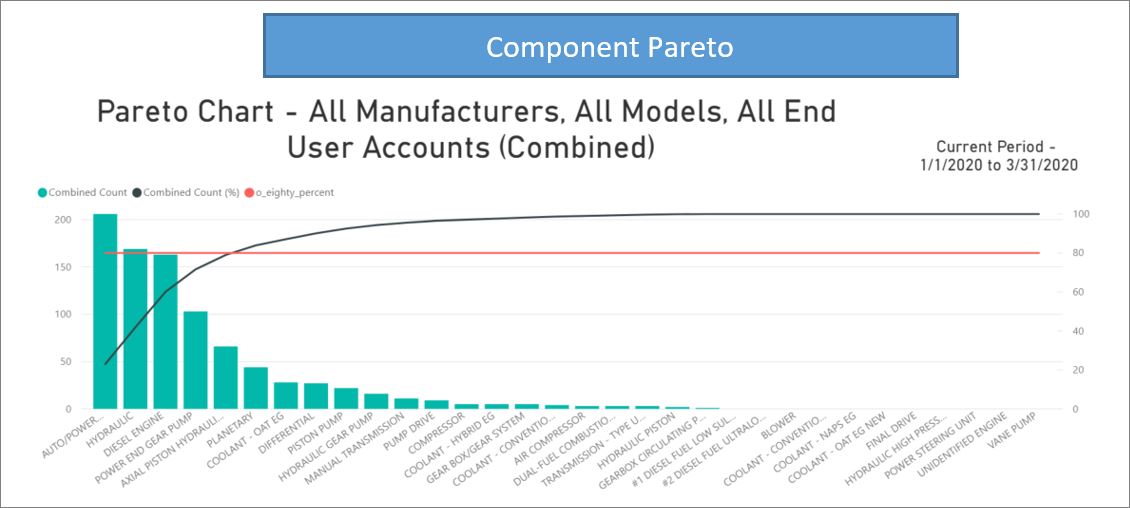
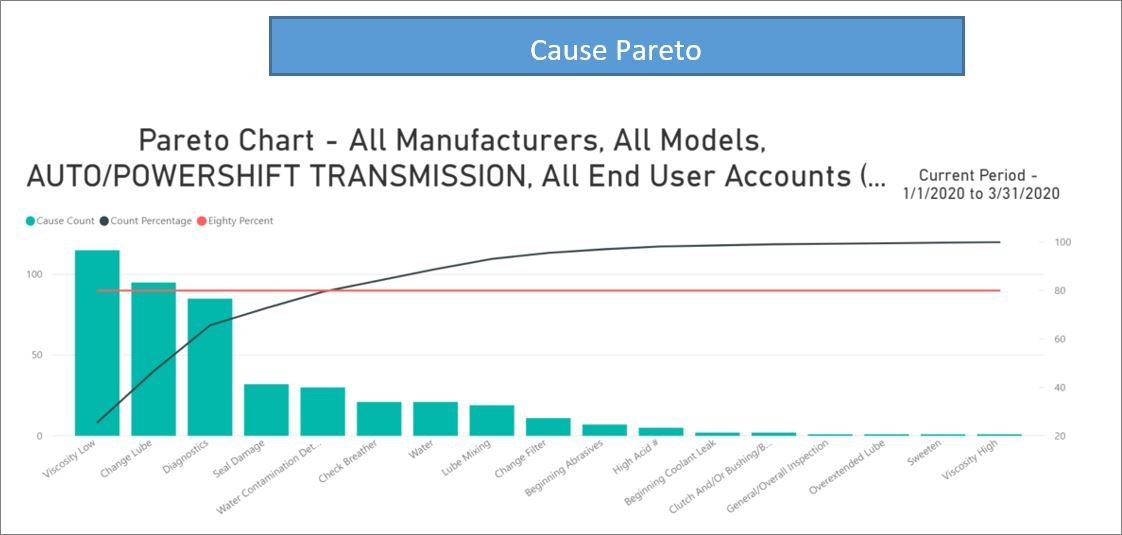
I now had a visual explanation of the components and the specific causes I needed to concentrate on if I wanted to decrease the number of future high severity reports.
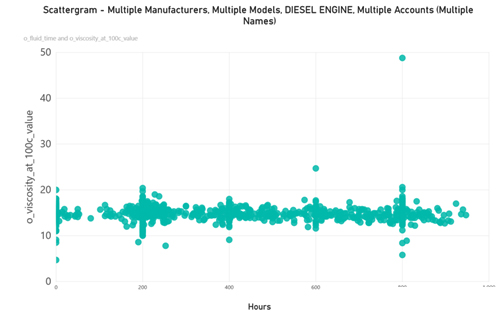
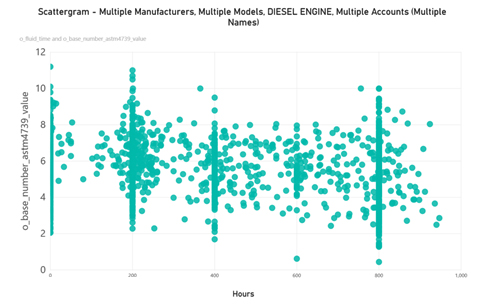
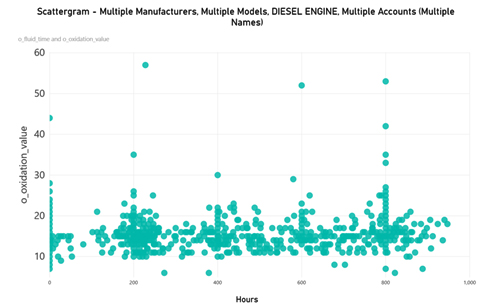
Using the same set of raw data, I then created Scattergrams to gain a better understanding of my lubricant properties and component wear compared to time on the lubricant. (Scattergrams are easily created in Excel.) I could now determine the optimum drain interval for my components with confidence.
